
Did you notice that in the new year, some Infoporte reports transitioned to Tar Heel Reports? Reports that were available as SAS VA inside of Infoporte are being moved to Tableau as Tar Heel reports. Here are some highlights about the Tar Heel reports and the benefits to you:
- Not all reports have transitioned to the new technology. If it was transitioned, you’ll see “Now in Tar Heel Reports” next to the report name.
- The Tar Heel reports are the same reports you had access to before with a notable change – security is different. You’ll see reports for all departments, not just your own. Don’t worry, it’s easy to filter and save your reports.
- When you click the name of a Tar Heel Report a new window opens with a Sign into Tableau Reports button.
Some Big Wins for You
- Downloading is easier and more intuitive. You can even pick specific or all columns to download.
- There are multiple formats to download to, including Image (png), Data (txt/csv), PDF and PPT.
- Tar Heel Reports load quickly. It’s a noticeable difference from loading SAS Visual Analytics reports.
- You can save your reports as Favorites. Filter for the department data you need, save your filter as a favorite “view”, and rename the view. You can even make it your default report.
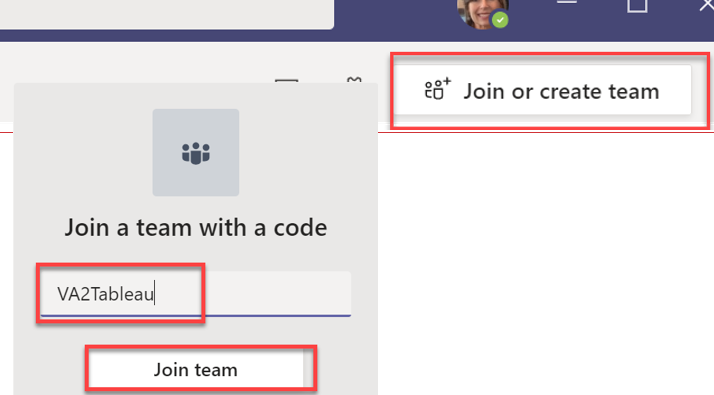
If you would like to stay in-the-loop on upcoming Tableau reports, please join the VA2Tableau team in Microsoft Teams. From the Team icon, click the Join or create a team button, type VA2Tableau into the code field and click the Join Team button.
Are you looking for the Expected End Date Report?
The Expected End Date report was a separate report option under the Reports tab in InfoPorte. Now there is an ‘Employees’ report that combines Active Faculty Report, Expected End Date Report, and Temporary Employees Planned End Date Report.
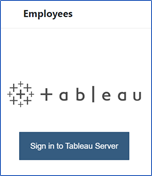
- Select the Employees report, and click the Sign in to Tableau Server button.
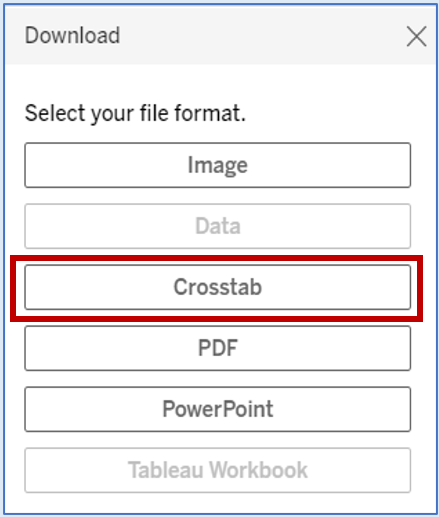
2. Click the Download button located at the bottom of the display page so you can have a sortable report.

3. Click the Crosstab option on the next screen.
4. Select either Excel or CSV format for the download.
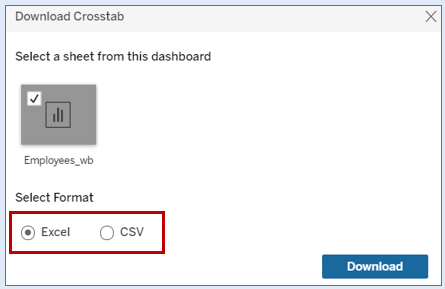
Once the report is created then you can sort/filter the report to customize it to your needs.